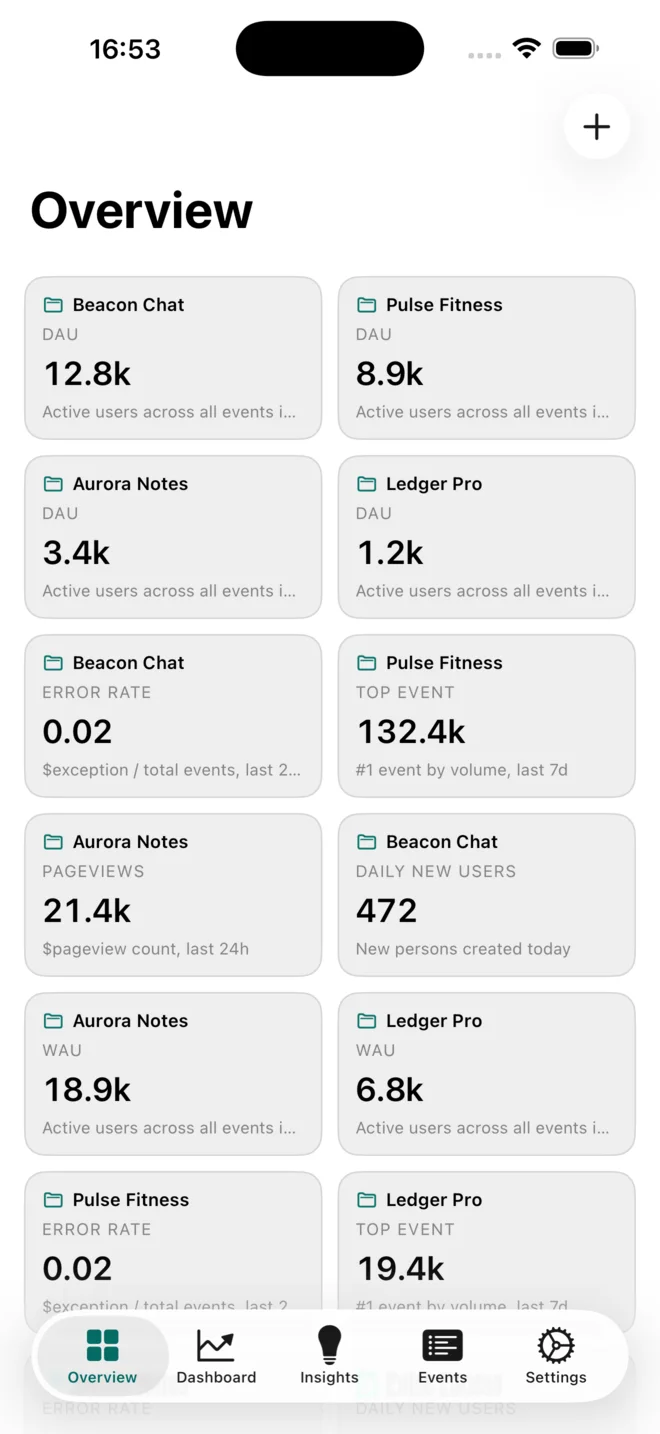
If you run more than one product, checking PostHog project by project turns a quick health check into a navigation task. Hogly’s Overview is designed around the opposite idea: put each product’s most useful signal in one place, then open a project only when the comparison gives you a reason.
The short version
- Give each project a small, decision-ready set of metrics instead of recreating every dashboard.
- Use the same health questions across projects, even when the exact events differ.
- Let Overview find the outlier, then continue inside that project for evidence.
The hidden cost of checking projects one by one
Project switching creates two kinds of friction. The obvious one is navigation. The less obvious one is memory: by the time you open the fourth project, you are trying to remember the first project’s numbers, time range, and whether its movement was actually unusual.
A cross-project Overview turns that serial task into a visual comparison. Each card carries a metric and its project context, so differences are visible at the same time rather than reconstructed from memory.
1. Choose metrics that can trigger a decision
The best Overview is intentionally incomplete. Start with one to three measures per project that answer a health question:
- Are people arriving? New users, signups, or acquisition conversion.
- Are they active? DAU, a core action, or a key funnel completion.
- Is the experience healthy? Error rate, failed actions, or another reliability signal.
- Is the business moving? Trial starts, upgrades, or a product-specific value event.
Do not add a metric only because it is easy to graph. Add it when a meaningful change would cause you to investigate, communicate, or act.
2. Compare questions, not event names
Different products rarely share the exact same event vocabulary. One product’s activation may be “created_link”; another’s may be “connected_project.” That does not prevent a useful portfolio view.
Normalize the question instead: what counts as activation for each product? What is the main failure signal? Which action best represents retained use? Hogly can place those project-specific answers side by side without pretending their raw events are identical.
3. Arrange the view around how you scan
Put the metrics you inspect most often first. Keep related signals close enough to compare, such as activity next to error rate, and avoid mixing several time horizons in one glance unless the difference is explicit.
Widgets can keep a few priority metrics on the Home Screen between deliberate check-ins. The Overview remains the better place for context, comparison, and the next navigation step.
4. Let the outlier choose the next screen
When a card looks unusual, open that project and follow the kind of signal you saw. A conversion change belongs in the relevant funnel or insight. A sudden error rate belongs in Error Tracking. A customer-behavior question may need Events or a Session Replay.
This is where Overview becomes more than a portfolio dashboard: it is the front door to a focused investigation. The context of the project travels with the signal, reducing the chance that you inspect or edit the wrong workspace.
A sustainable check-in rhythm
Use Overview at moments when a decision is possible: before the workday, after a release, when a customer report arrives, or during a known campaign. Constant checking creates anxiety without adding information.
A practical routine is one morning pulse, event-driven checks for real signals, and a deeper desktop review on the cadence your team already uses. Hogly makes the quick layer convenient; it does not need to turn analytics into a slot machine.
Over time, review whether every pinned metric still earns its place. Remove cards that never change a decision, and replace them when a product reaches a new stage. An early product may need activation and error signals; a mature subscription product may care more about retained use, upgrades, and support volume. The Overview should evolve with the questions you are responsible for answering.
Quick answers
Frequently asked.
Can Hogly show several PostHog projects at once?
Yes. Hogly Overview is multi-project by default and can place pinned metrics from different PostHog projects in one mobile view.
Which metrics should I pin first?
Start with the smallest set that can change a decision: typically one acquisition or activity signal, one core value signal, and one reliability signal per project.
Does Overview replace PostHog dashboards?
No. Overview is a cross-project pulse and navigation layer. Open the project’s dashboards, insights, events, errors, or replays when you need deeper evidence.