You cannot diagnose Session Replay from one Lighthouse score or a slow feeling. Reproduce the same interaction in three controlled arms: no analytics SDK, PostHog analytics with replay disabled, and PostHog with replay confirmed active. Save traces and compare distributions before changing production settings.
The short version
- Compare baseline, analytics-only, and replay-enabled arms with the same page, browser, CPU profile, cache state, and scripted interaction.
- Confirm each replay arm produced a usable recording; an unsampled or disabled session is not evidence of low recording cost.
- Use lab traces to identify causes and field INP to understand user impact. Do not turn one device run into a universal performance claim.
Turn “the app feels slow” into one observable interaction
Official documentation, release records, and issue state checked September 20, 2026. This article gives you a test design and a synthetic fixture. It does not contain a Hogly benchmark, customer result, or claimed percentage improvement. Browser, application, DOM, recorder, and device costs vary too much for an invented average to help.
Start from a real user action: opening a data table, switching a dashboard tab, filtering a list, expanding a tree, or navigating to a node-heavy route. Write the beginning and end conditions so another engineer can repeat them. “Click the Customers tab after the ready marker; stop after the table and count badge paint” is measurable. “Browse around until it feels slow” is not.
Use field data to choose the interaction when you have it. Google's INP guidance says field data is the best way to identify slow interactions and lab testing is useful for reproducing and diagnosing them. A lab trace can explain main-thread work; it cannot predict when all real users interact or replace field INP.
Freeze the fixture and run manifest
Record the page commit, browser build, operating system, hardware, viewport, CPU throttling preset, network preset, cache state, PostHog package version, loaded recorder URL, project replay rules, and approximate DOM node count. If any of those change between arms, you have introduced another possible cause.
Download the synthetic table fixture. It creates deterministic fake rows and marks its rebuild interaction. It does not load PostHog or claim to represent your production UI. Use it to validate your harness, then repeat the same design on the actual route users report. Keep real customer content out of shared traces.
| Input | Example record | Keep constant |
|---|---|---|
| Page | Commit, route, fixture size, feature flags | DOM shape and application work |
| Browser | Full version, clean profile, viewport | Runtime and extension environment |
| Device | Hardware and calibrated CPU preset | Available CPU and memory |
| PostHog | SDK version, recorder URL, defaults, project | Loaded implementation and remote rules |
| Journey | Ready mark, action script, completion mark | Timing window being compared |
Chrome DevTools notes that CPU throttling is relative to the host computer and does not turn a desktop CPU into a particular phone CPU. Use the same calibrated preset for comparison, then reproduce on representative hardware before making a release claim.
Run three required arms and one optional production arm
Build three configurations from the same commit. Arm A loads no analytics SDK. Arm B loads PostHog and captures the normal analytics events for the journey while Session Replay is disabled. Arm C uses the same PostHog configuration with Session Replay enabled and confirms that the test session was actually recorded.
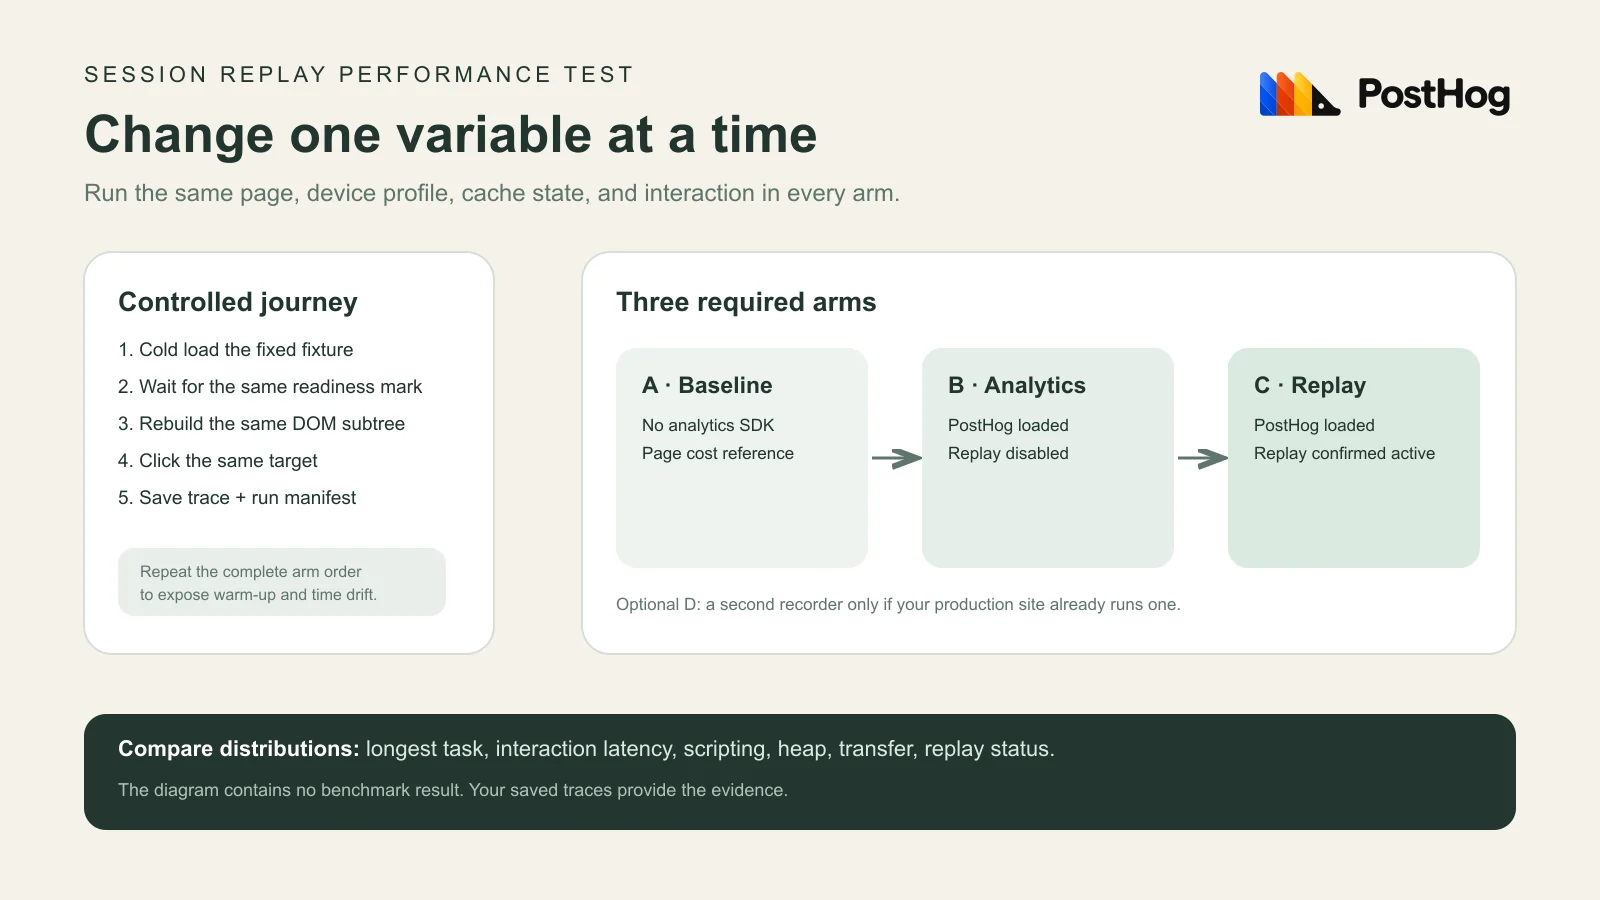
Add Arm D only when your production page already runs a second recorder. Test the real combination, then turn off one recorder at a time. Do not add a second vendor to production solely to complete a diagram. Two tools may duplicate DOM observation, snapshot, serialization, network, and memory work; the size of that cost must come from your trace.
Sampling does not remove the need to check Arm C. PostHog's current rules deterministically select sessions by session ID. A session that was not selected provides no measurement of active recording. Sampling may reduce the number of sessions recorded across traffic; it is not a percentage you can subtract from the cost of an individual recorded interaction.
Alternate repeated runs instead of collecting one screenshot
Choose a run count before looking at the result. Seven measured runs per arm is a practical starting point for local diagnosis, preceded by one explicit warm-up run that you exclude from every arm. Alternate the arm order across rounds, such as A-B-C, C-B-A, and B-A-C, so browser warm-up, temperature, and background work do not always favor one configuration.
- Start the clean browser state defined in the manifest.
- Open the fixed route and wait for the same readiness marker.
- Begin a DevTools runtime performance recording.
- Perform the exact scripted interaction once.
- Stop the recording after the same completion marker and quiet window.
- Save the trace, network log, console log, and run manifest using the arm and round number.
- For Arm C, save the replay URL or an explicit ingestion readback after the run.
Record cold-load and runtime interactions separately. Loading, parsing, and initializing an SDK answers a different question from rebuilding a 10,000-node table after the page is ready. Mixing them into one window prevents useful attribution.
Read the interaction, main thread, transport, and replay together
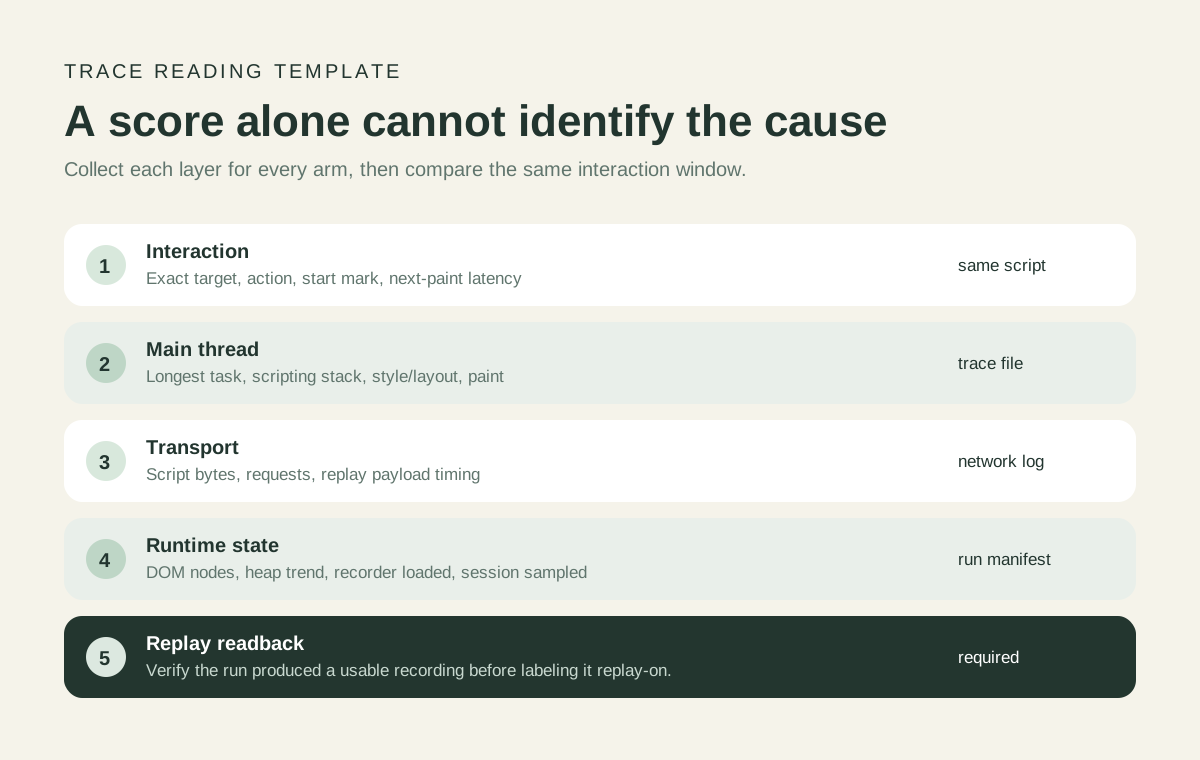
For each trace, record the interaction latency and its input delay, processing, and presentation components; the longest main-thread task in the action window; scripting time attributed to your app and recorder; style, layout, and paint work; network request and transfer totals; heap trend; and DOM-node count. Chrome's Performance panel exposes runtime tasks and call stacks, while the Performance monitor can track DOM nodes, CPU, heap, layouts, and style recalculations.
Compare per-arm distributions: median, minimum, maximum, and every raw measured run. With a small diagnostic sample, describe what you observed instead of claiming statistical significance. A large gap in one run is a lead to reproduce, not a finished conclusion.
Attribution matters. If A, B, and C all show the same long layout task, the page is the first suspect. If B differs from A before recording begins, SDK load or analytics work merits inspection. If C alone adds long rrweb-record.js serialization tasks during a structural DOM update, the replay path is implicated for that fixture and stack. If network bytes rise but main-thread tasks do not, report transport separately from responsiveness.
The current large-DOM issue is closed, but the follow-up is unresolved
posthog-js issue #4217 documented synchronous Session Replay work while serializing a large DOM and closed as completed on September 8, 2026 after a series of performance changes. The issue reporter then tested posthog-js 1.429.1 and commented on September 10 that blocking was reduced but still present in a moderate-DOM Angular table rebuild, asking for the issue to be reopened. As of this check, GitHub still reports the issue closed.
That record supports two narrow statements: PostHog shipped targeted performance changes, and at least one public follow-up reports that the practical freeze was not eliminated for its workload. It does not establish that every current site is slow, that every site improved by the same amount, or that your trace will match the numbers in the issue.
The merged work itself describes scoped improvements. For example, PR #4808 deduplicated pending mirror-removal roots and explicitly said recording remained synchronous. PR #4816 optimized repeated shadow-connectivity walks and stated that it did not resolve #4217. Use the issue as a trigger pattern for a large or frequently rebuilt DOM, then measure the version and page you ship.
Choose a fix from the trace and repeat the same arms
If the page dominates all arms, reduce or virtualize the rendered DOM, avoid replacing a whole subtree for a small state change, and profile the resulting layout and paint work. If high-frequency attribute changes dominate the replay arm and you run posthog-js 1.395.0 or later, evaluate the ADVANCED session_recording.attributeFilter configuration against the attributes your replay actually needs. PostHog's source reference says this allowlist is normally changed with PostHog support guidance. Mutations to attributes omitted from the list never reach the recorder, so those attributes also disappear from the replay. The official 1.395.0 changelog records when the option was added. It targets attribute mutation capture; it does not promise to fix structural rebuilds or full snapshots.
If only a known, nonessential, node-heavy region causes recording work, blocking that region from replay can be a focused mitigation, but it removes debugging evidence and changes privacy/capture behavior. Re-run visual replay acceptance after any block or mask change. If two replay SDKs are active, repeat with each recorder alone and decide whether the duplicate evidence justifies the measured combined cost.
Use trigger groups and sampling to choose which sessions are worth recording and to control volume. Current PostHog documentation says trigger groups support conditions plus their own sample rate and minimum duration. Those controls change eligibility and ingestion; measure a session in which recording is confirmed before drawing a runtime-cost conclusion.
After one change, repeat the same alternating arms and compare the raw traces. Then watch field INP and the affected interaction after release. A faster synthetic table does not prove that every real route improved.
Publish a result another engineer can challenge
A useful internal report contains the manifest, exact journey, arm definitions, complete run order, raw per-run measurements, representative trace files, replay readback, exclusions, and limitations. State whether the effect reproduced on a representative device and whether field data points to the same interaction.
Avoid “PostHog costs 18%” unless you define the measured quantity, sample, page, device, and uncertainty. A better conclusion is: “On commit X in Chrome Y with the calibrated 4× preset, the replay-confirmed arm added a repeatable serialization task during the Customers table rebuild; it did not reproduce on the Settings route. The attached seven-run distribution and traces show the difference.”
If replay is useful after the performance gate, retain the traces as a regression fixture and use Hogly's error-to-replay workflow or PostHog web to inspect the resulting recordings. Hogly reads recordings already captured by PostHog and does not change browser recording cost.
Measurement and PostHog references
- Chrome DevTools Performance reference — runtime traces, CPU throttling, and trace controls.
- Interaction to Next Paint and manual lab diagnosis — field/lab roles and interaction attribution.
- PostHog recording rules — current trigger groups, sampling, minimum duration, and version boundaries.
- posthog-js #4217 — a historical large-DOM trigger and current follow-up context, not a benchmark for your site.
Quick answers
Frequently asked.
Does PostHog Session Replay slow every website?
There is no universal result. The cost depends on the browser, device, DOM, mutation pattern, SDK and recorder versions, and recording state. Use controlled replay-confirmed traces for your pages.
Can I test replay performance with Lighthouse?
Lighthouse can identify load-related signals, but a replay diagnosis needs a scripted runtime interaction and a Performance trace. Field INP is needed to understand impact on real users.
Why compare analytics-only with replay enabled?
That arm separates ordinary PostHog SDK and event work from the additional recording path. A no-SDK baseline alone cannot isolate those layers.
Does a 10% replay sample rate mean 10% of the CPU cost?
No. Sampling changes which sessions are recorded. Measure a session confirmed as recorded to understand the cost of active recording on that page.
Should I run two session replay SDKs?
Test the combination only if it reflects your production setup. Compare each recorder alone and together, then decide whether the extra evidence justifies the measured CPU, memory, and network cost.